Challenge
A platform engineering team was running a portfolio of SQL workloads and DevOps pipelines, but their reporting was a mix of SSMS queries, DevOps queries, and the occasional Excel pivot. Stakeholders asking "what's the platform doing this quarter" got an inconsistent answer depending on who they asked.
Approach
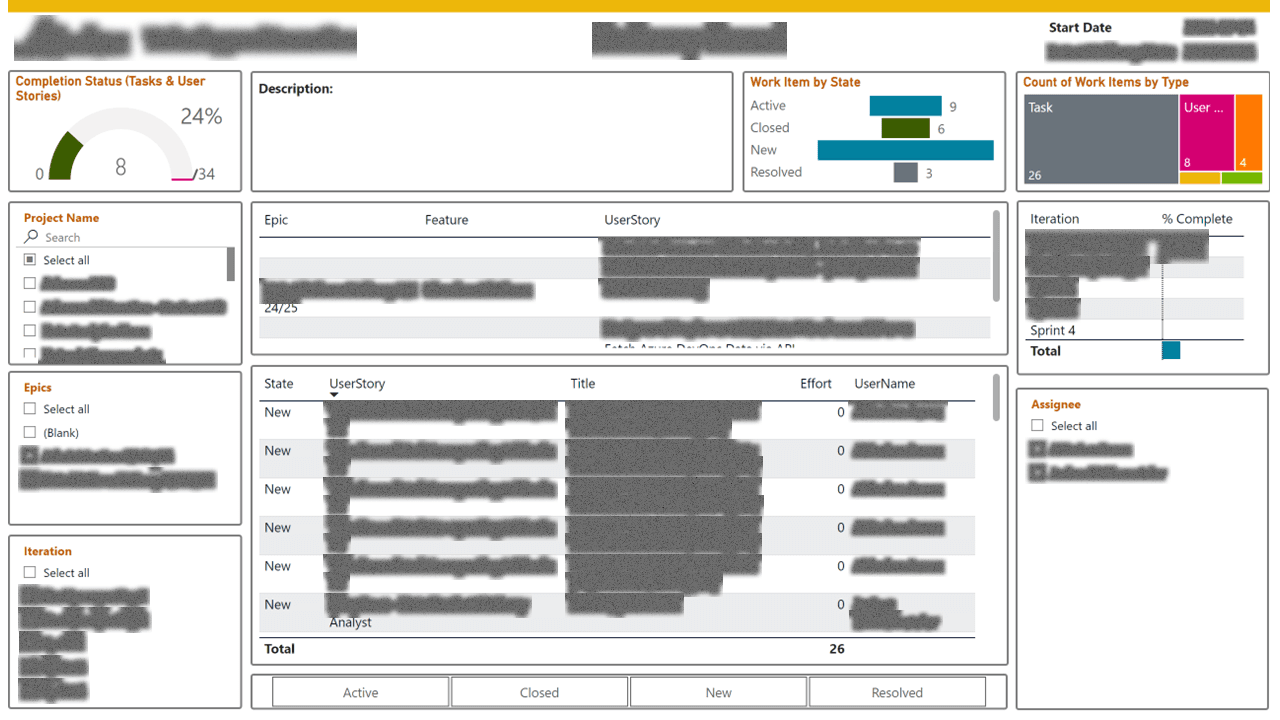
I modeled the SQL Server metadata and DevOps work-tracker exports as a single semantic layer in Power BI, then built a services overview with drill-through to project-level detail. Report notes are versioned in the model itself so the artifact carries its own context — a reader opening it cold knows what they're looking at without a Confluence detour.
Outcome
The report became the standing platform-engineering update, replacing the assemble-on-demand reports the team used to pull together for each review. The semantic model is the asset that lasts; the visuals are the disposable interface on top.


